 BTC
BTC  ETH
ETH  XRP
XRP SOL
SOL  DOGE
DOGE There is a number that quietly lives in the back of every working adult’s mind: am I saving enough? Fidelity, the largest 401(k) recordkeeper in the United States, has spent years refining an answer. Its age-based milestones are the most quoted retirement benchmarks in personal finance — and the most misunderstood.
Here is the key thing to get straight before the numbers: these are guideposts, not grades. Fidelity itself calls them aspirational — most people will not hit every one. Their job is to tell you your pace, not your worth.
The Fidelity milestones: salary multiples by age
Fidelity’s guideline is built on salary multiples rather than dollar amounts, so it scales to any income. The full schedule:
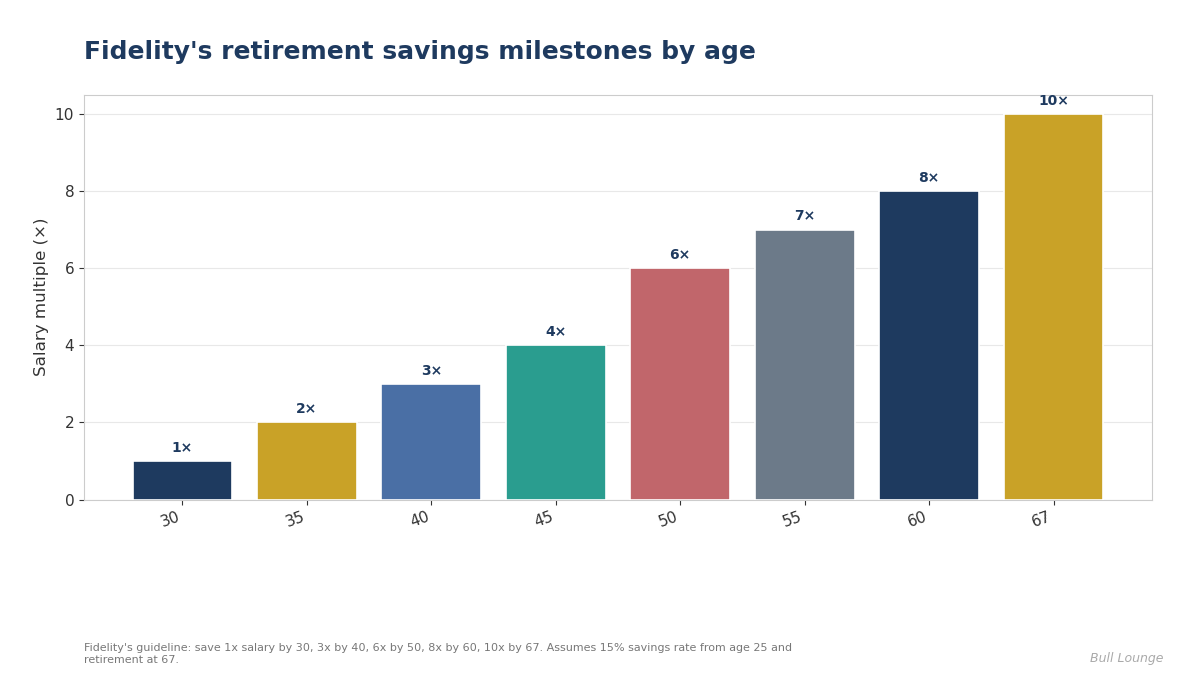
| Age | Target multiple | On a $75,000 salary | On a $120,000 salary |
|---|---|---|---|
| 30 | 1x | $75,000 | $120,000 |
| 35 | 2x | $150,000 | $240,000 |
| 40 | 3x | $225,000 | $360,000 |
| 45 | 4x | $300,000 | $480,000 |
| 50 | 6x | $450,000 | $720,000 |
| 55 | 7x | $525,000 | $840,000 |
| 60 | 8x | $600,000 | $960,000 |
| 67 | 10x | $750,000 | $1,200,000 |
These targets rest on specific assumptions: you save 15% of income every year starting at age 25 (including any employer match), keep more than half of your savings in stocks on average over your lifetime, retire at 67, and aim to maintain your preretirement lifestyle. Under those assumptions, Fidelity estimates your savings need to cover about 45% of your preretirement income, with Social Security filling the rest.
Change any assumption and the multiples shift. Plan to retire at 60 instead of 67? You will need considerably more. Expect a paid-off house and low spending? You may need less. The multiples are a starting point for a plan, not the plan itself.
What the numbers look like in practice
To see how the 15% rule compounds, consider a hypothetical earner making $75,000 who saves 15% every year from age 25. The chart below is a simplified illustration — flat salary, steady 7% annual return — not a prediction.
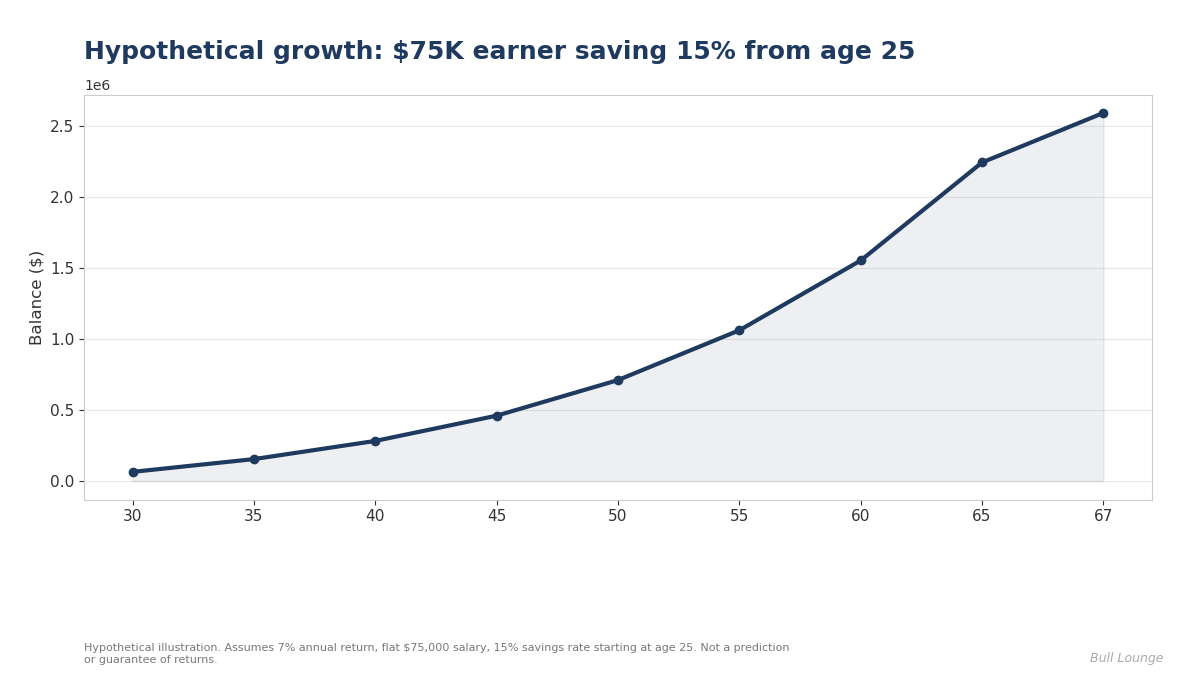
The early years look painfully slow. By 35 the balance is only around $155,000 in this illustration — then compounding visibly accelerates. That shape is the entire argument for starting early: time does more work than money in the first two decades.
What if you’re behind?
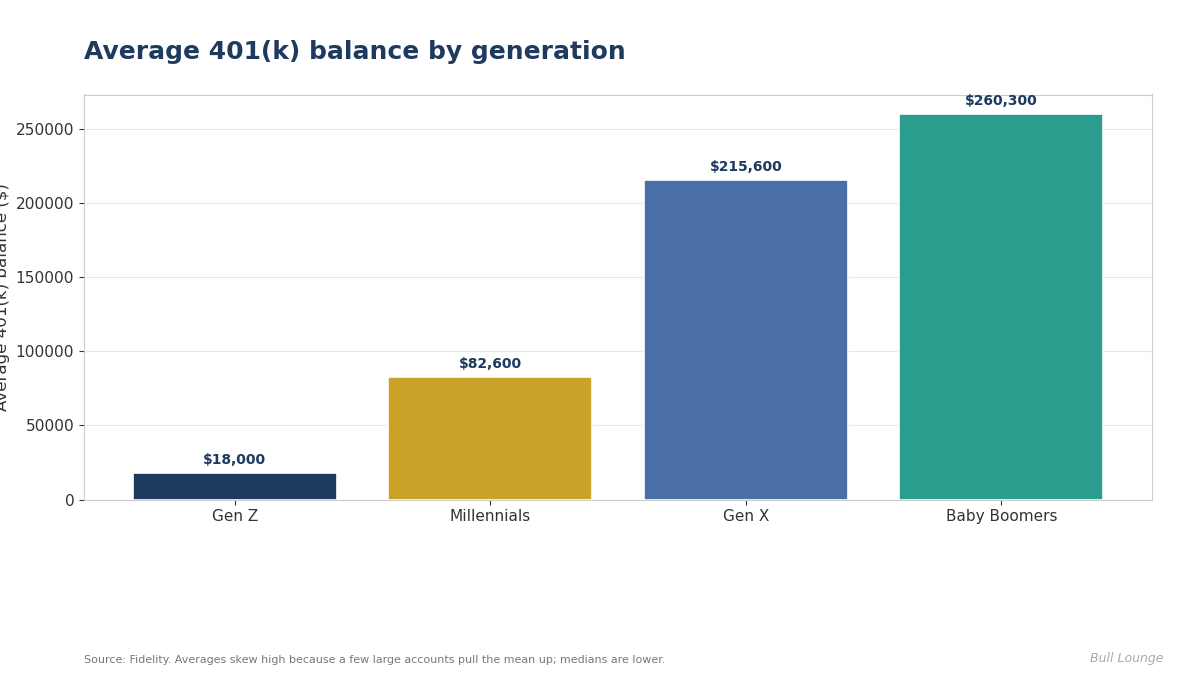
Most people are. The average 401(k) balance for Gen X savers is about $215,600, according to Fidelity — and averages flatter reality because a few large accounts pull the mean up. Vanguard’s 2026 “How America Saves” report puts the median 401(k) balance for workers aged 45 to 54 at just $78,730. On a $75,000 income, that is roughly one times salary at an age when the benchmark calls for nearly six.
If that is you, here is the honest catch-up math, decade by decade:
In your 30s: the rate matters most
You still have 25-plus years of compounding ahead. The single highest-impact move is raising your savings rate — even by one or two percentage points a year, ideally timed right after each raise so you never feel it. Going from 10% to 15% on an $80,000 salary is an extra $4,000 a year, or about $154 per paycheck if you are paid biweekly. Also: capture the full employer match before anything else. It is the only guaranteed return in investing.
In your 40s: combine rate with catch-up vehicles
Run the numbers coldly. A 40-year-old starting from zero, earning $80,000 and saving 20% ($16,000 a year), would accumulate roughly $221,000 by 50 under a hypothetical 7% return — well short of the $480,000 six-times benchmark. That is not a reason to despair; it is a reason to be realistic. Your levers now are a higher savings rate, an IRA alongside the 401(k), an HSA if eligible, and possibly a later retirement date — each extra working year is one more year of contributions and one fewer of withdrawals.
In your 50s: use the tools built for this decade
This is what catch-up contributions exist for. In 2026 you can put an extra $8,000 into a 401(k) once you turn 50 ($11,250 at ages 60–63), plus an extra $1,100 into an IRA. One caution new for 2026: if you are 50 or older and earned more than $150,000 in 2025, catch-up contributions must go in as Roth (after-tax) dollars under SECURE 2.0. Also audit the big fixed costs — housing is usually the largest lever left. Downsizing or relocating in your late 50s can do more for retirement readiness than any portfolio tweak.
What if you’re ahead?
Being ahead of the milestones is a good problem with its own traps. First, do not throttle down to “just enough” — benchmarks assume average markets, and averages include long flat stretches. Second, consider tax diversification: if everything is pre-tax, every retirement dollar will be taxed as ordinary income, so building Roth balances while you are ahead gives you control over your tax bracket later. Third, rebalance at least annually; allocations drift while you are not looking.
The 3 levers that actually determine the outcome
Every retirement projection, Fidelity’s included, is driven by three inputs. Ranked by how much control you have over them:
1. Savings rate. This is the variable you fully control, and financial planners consistently call it the single most important determinant of long-term wealth. Markets are unpredictable; your contribution percentage is a decision. Fidelity’s entire milestone schedule assumes 15% including the match — if you are at 6%, you are running a different race than the benchmark describes.
2. Time. Starting at 25 versus 35 is not a 10-year handicap; because of compounding, it is closer to a doubling of the required savings rate to reach the same endpoint. Every year of delay raises the price of the same goal. This is also why the milestones get steeper with age — the schedule assumes compounding is doing heavy lifting in the background.
3. Returns. You influence this through asset allocation and fees, not through picking winners. Fidelity’s model assumes more than 50% in stocks on average across a lifetime. The practical version: use low-cost index funds, keep fees low, and do not try to time the market. A 1% annual fee drag over 30 years quietly consumes roughly a quarter of your potential balance.
Why net worth benchmarks can mislead
Salary-multiple benchmarks measure retirement savings, not net worth — and the distinction matters. Home equity, for example, counts toward net worth but does not pay for groceries unless you sell or borrow against it. A $400,000 paid-off house and a $100,000 401(k) is a very different retirement position than a $100,000 house and a $400,000 401(k), even though both are $500,000 net worths.
Similarly, the benchmarks ignore pensions, rental income, and expected inheritances — all of which legitimately reduce what you need to save. And they assume Social Security pays as scheduled, which is its own debate. Use the milestones to check your pace on the savings you control; build the full picture separately with everything you own and everything you expect.
FAQs
Do the milestones include my house?
No. They measure retirement savings — 401(k)s, IRAs, HSAs, taxable investment accounts earmarked for retirement. Home equity is real wealth, but it is not retirement income until you convert it.
What if I started saving at 35, not 25?
Then the schedule’s core assumption does not describe you, and hitting every milestone is unlikely without a higher savings rate. That is normal — the milestones are aspirational by design. Save 15–20%, capture every match, and measure progress against your own trajectory rather than a table built for someone who started a decade earlier.
Should couples double the targets?
Not exactly. Two earners usually means two 401(k)s and two IRAs, which is more tax-advantaged room — a real advantage. But the multiple applies to household income, so a couple earning $150,000 combined aims for the same multiples of $150,000. Shared expenses also mean the household may need less than two singles would.
Are these numbers adjusted for inflation?
Because the benchmarks are multiples of your salary — which itself tends to rise with inflation — they are roughly self-adjusting. That is the elegance of the salary-multiple approach: it sidesteps the need to forecast prices decades out.
The bottom line
Fidelity’s milestones — 1x by 30, 3x by 40, 6x by 50, 8x by 60, 10x by 67 — are the best-known pace chart in retirement planning, built on a 15% savings rate from age 25 and retirement at 67. Most savers trail them; the median 45-to-54-year-old holds about one times salary in a 401(k), not six. The productive response is arithmetic, not guilt: raise the savings rate you control, give compounding time, and keep fees low. Check your pace once a year, adjust, and move on. That is what the benchmarks are for.
Not financial advice. Do your own research.
Sources
- The Motley Fool — How Does Your Retirement Savings Compare to Average 401(k) Balances by Age?
- PocketGuard — Average Retirement Savings by Age (2026 Data)
- TheStreet — Fidelity Flags a $234,300 401(k) Gap at Age 50
- BrokerChooser — Is Your 401(k) on Track? What Fidelity Says About Mid-Career Retirement Savings
