 BTC
BTC  ETH
ETH  XRP
XRP SOL
SOL  DOGE
DOGE - This topic is empty.
-
AuthorPosts
-
October 15, 2026 at 7:45 am #2399
Bitcoin is sitting exactly where bulls want it. After a violent flush to just above $80,000, BTC held the median line of its rising channel and has already bounced to ~$82,260 — and the weekly chart is telling the same story on a bigger timeframe.
The daily channel’s upper boundary sits near $88,000 — a clean break above it opens a measured-move target north of $110,000. Meanwhile, the weekly chart shows price bouncing off a rising trendline drawn from the post-correction lows. Two timeframes, one message: the trend is defending itself. Here’s the full technical breakdown.
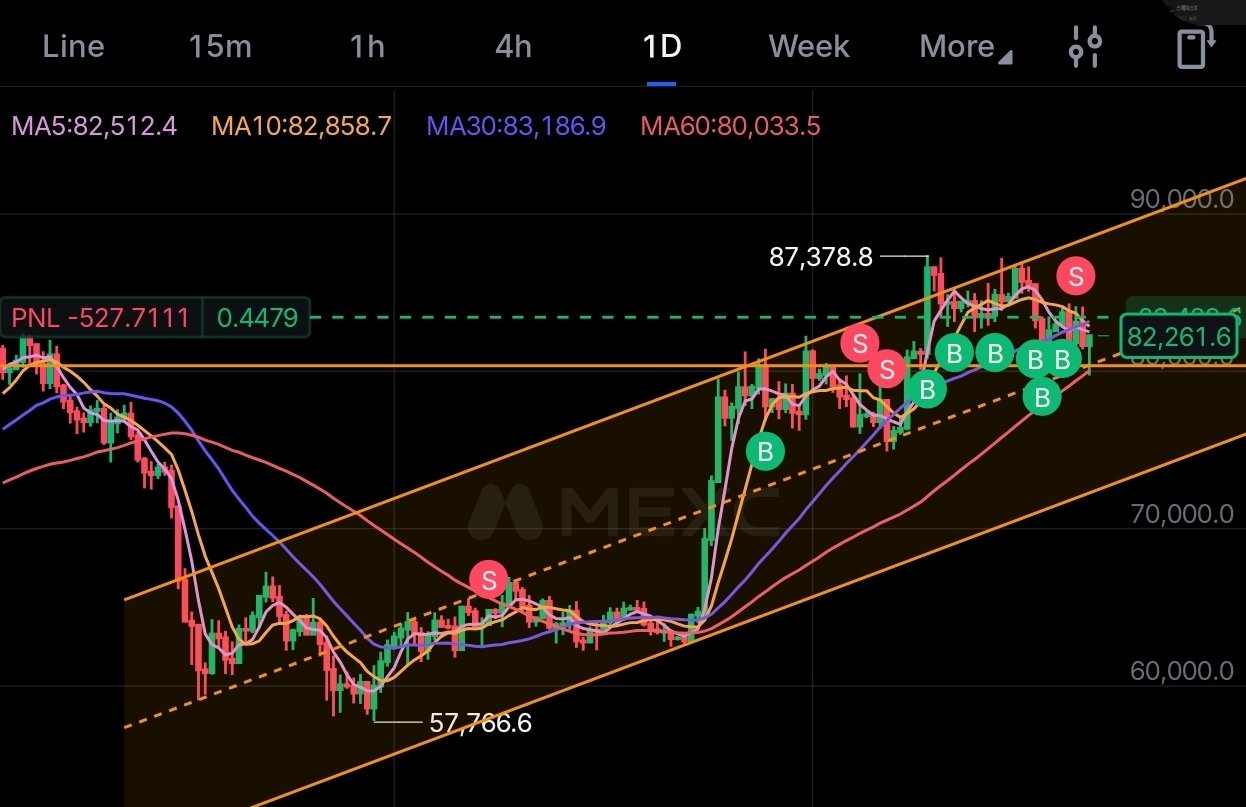
Daily chart with author’s rising-channel construction, updated. Source: author’s own analysis.
The Channel: Textbook Structure
Draw the parallel lines and the picture is clean. The rising channel anchors at the $57,766.6 swing low and the $87,378.8 swing high — a range of roughly $29,600, or about 51% from trough to peak.
What makes this channel tradeable rather than decorative is the number of touches. Price has respected the lower boundary on every major pullback since the low, tagged the upper boundary on the advance, and — most importantly — has now bounced off the median line multiple times. In median-line (Andrews pitchfork) theory, the center line is where a trend proves itself: a trend that keeps catching bids at its midpoint is a healthy trend.
- Lower channel line: rising support, currently in the low-$70,000s zone
- Median line: ~$80,000–$81,000 — the battleground, holding so far
- Upper channel line: ~$88,000 — the breakout trigger
Moving Averages: The Bounce Is Underway
The bounce off the median line is already in motion. From the ~$80,950 lows, BTC has reclaimed $82,260 and is pressing into the short-term moving average cluster.
The MA60 at $80,033.5 held as dynamic support — this is the line that separates an intact uptrend from a broken one on the intermediate timeframe, and it did its job. Above, the MA5 ($82,512.4), MA10 ($82,858.7), and MA30 ($83,186.9) form a tight resistance band. The sequence matters: hold MA60 (done), reclaim the MA5/MA10/MA30 cluster (in progress), then attack the channel top. Each step unlocks the next.
The Weekly Chart: The Bigger Trendline Is Holding
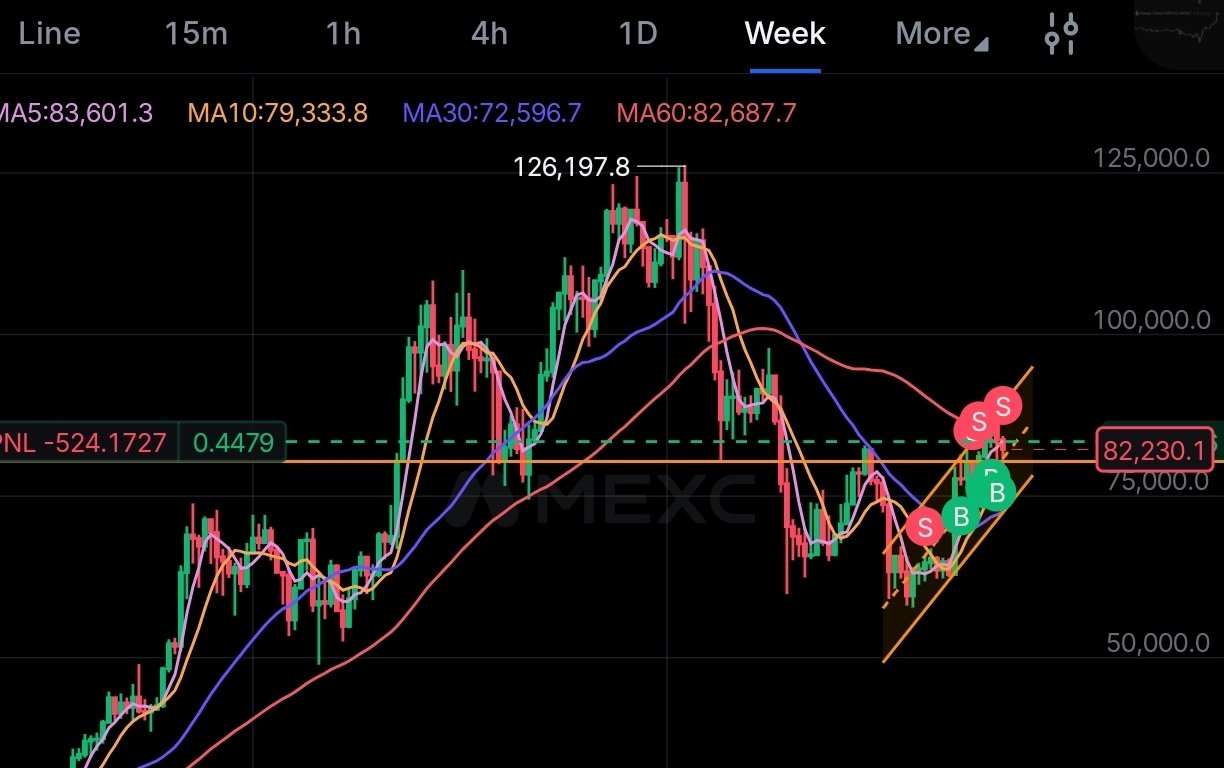
Weekly chart with author’s rising trendline from the post-correction lows. Source: author’s own analysis.
Zoom out and the structure gets even more compelling. The weekly chart shows Bitcoin bouncing off a rising trendline drawn from the correction lows — the same kind of higher-lows construction that defines every sustained bull market. The sell markers near the top marked the distribution zone; the buy markers are now printing right at the trendline. That’s textbook trend behavior: sell the overbought extremes, buy the trendline tests.
The weekly moving averages frame the trade beautifully. The weekly MA10 ($79,333.8) and MA30 ($72,596.7) sit below as layered support — even a deeper pullback has a safety net. The one to watch is the weekly MA60 at $82,687.7, hovering just above the current price: reclaiming it on a weekly closing basis would confirm the bounce has legs.
And the prize for patience is visible at the top of the chart: the $126,197.8 all-time high. A weekly trendline that holds here keeps the path of least resistance pointed at a retest of those highs. As long as this line holds, dips are for buying — the moment it breaks on a weekly close, the thesis changes.
The Bull Case: What a Breakout Means
Here’s the math that matters. A decisive daily close above the channel top (~$88,000) with volume would complete the pattern. The textbook measured move is the channel width — ~$29,600 — projected from the breakout point. That puts the technical target near $117,000.
Round numbers will fight back first: $90,000, then the psychological $100,000 magnet. But in a genuine channel breakout, prior highs become launchpads, not ceilings. The $87,378.8 swing high is the line in the sand — a weekly close above it confirms the breakout is real, not a fake-out.
Note the systematic buy/sell markers riding the channel on the daily chart: disciplined channel traders have been accumulating the median-line touches and distributing into the upper boundary. When that upper boundary finally gives way, those same traders flip from sellers to chasers — which is exactly how breakouts accelerate.
The Bear Case: Know Your Invalidation
Professional analysis states the invalidation plainly. On the daily chart, if BTC loses the median line on a daily closing basis and the MA60 ($80,033.5) fails with it, the next stop is the lower channel line in the low-$70,000s. On the weekly chart, a weekly close below the rising trendline breaks the bigger structure and opens the $64,000–$66,000 zone.
A rising channel that breaks down tends to move fast. Respect the levels; don’t marry the thesis.
Macro Backdrop: Headwinds Fading?
The macro tape is noisy but improving at the margin. October Fed hike odds spiked to ~47% after the hot CPI print, then faded back to ~26–29%. The 10-year yield has pulled back from 5.36% to 5.08%.
Asia was ugly overnight — the KOSPI plunged 8% and triggered circuit breakers, the Nikkei fell 4.4% — yet Bitcoin held $80,000. That relative strength against a regional equity meltdown is notable: BTC is acting less like a high-beta tech proxy and more like an asset with its own bid.
Flows help the story too: spot BTC ETFs saw +$175M of inflows on October 14, a sharp reversal from the prior week’s bleeding. ETF demand has been the marginal buyer all year — its return matters.
Key Levels to Watch
Level Significance $80,033.5 Daily MA60 — held as support, must keep holding $82,512–$83,187 Daily MA5/MA10/MA30 resistance cluster (being tested) $82,687.7 Weekly MA60 — next resistance on higher timeframe $87,378.8 Swing high — breakout confirmation ~$88,000 Daily channel top — the trigger $100,000 Psychological magnet above the breakout ~$117,000 Measured-move target (channel width projected) $126,197.8 All-time high — the long-term prize Risks
- Macro reversal: A hot PPI or hawkish Fed surprise could re-accelerate hike odds and crush risk assets.
- Channel failure: A daily close below the median line + MA60 opens the low-$70,000s quickly; a weekly close below the rising trendline breaks the bigger structure.
- False breakout: Crypto is famous for stop-hunting above resistance. Demand a daily (ideally weekly) close above $88,000, not a wick.
- Correlation risk: If the Asian equity rout spreads to US markets, BTC’s defenses get retested.
Bottom Line
Bitcoin is defending the most important technical junction of its current trend on two timeframes at once: the daily chart is bouncing off the channel’s median line with the MA60 holding beneath it, and the weekly chart is bouncing off a rising trendline from the correction lows. The $88,000 channel top is the trigger for a measured move toward six figures and beyond — and the $126,197.8 all-time high is the prize if the weekly trendline keeps holding. The structure is intact until it isn’t — and right now, on both timeframes, it is.
Related reading: Morning Briefing Oct 14: Hot CPI, ASML Beats · Market Close Oct 14: Hot CPI Sinks Stocks
What’s your read — does BTC break $88,000 this month, or does the median line finally give way?
Sources
- CoinDesk — Bitcoin rebounds from near $80,000 as Kospi plunges 8%: coindesk.com
- CoinDesk — Bitcoin, copper, stocks, yields all fall; gold rises: coindesk.com
- Charts: author’s own technical analysis (daily and weekly timeframes)
Not financial advice. Do your own research.
Log in to vote -
AuthorPosts

More from Coin Talkmore +
| Title | Author | Date | Replies |
|---|---|---|---|
| BTC/ETH Weekly Thread: Bitcoin Holds $82K After PPI Shakeout [0] | Corncho | 10-15 | 0 |
| BitMine’s 5% ETH Cap: Who Fills the $193M Weekly Buying Void? [0] | Master | 10-12 | 0 |
| Ethereum (ETH) Analysis: Direction Check – Can ETH Lead the Next Leg? [0] | Master | 09-26 | 0 |
| Bitcoin (BTC) Analysis: Direction Check – Is the Bull Market Back? [0] | Master | 09-26 | 0 |
| Warning designations seem to kill pumps before they start [0] | Master | 09-24 | 0 |
| People are asking AI to predict the next rotation pump — thoughts? [0] | Master | 09-24 | 0 |
| Which sector are you watching right now? [0] | Master | 09-24 | 0 |