BTC
BTC  ETH
ETH  XRP
XRP SOL
SOL  DOGE
DOGE - This topic has 0 replies, 1 voice, and was last updated 10 hours, 32 minutes ago by
Corncho Lv.1 · Lv.1 Rookie.
-
AuthorPosts
-
October 15, 2026 at 8:05 pm #2449
Meta Platforms (NASDAQ: META) reports Q3 2026 earnings on Wednesday, Oct 21, after the close. This preview covers what the Street expects, how that stacks up against Meta’s own guidance, and the four things that will probably move the stock more than the headline EPS: 2027 capex, Muse monetization, the ~$10B legal charge, and Reality Labs.
Data as of the Oct 15, 2026 close unless noted. Sources are listed at the bottom.
TL;DR
- Street consensus (MarketBeat): EPS $6.76 on revenue $63.30B. That revenue figure sits in the top half of Meta’s $61–64B guide and would mean about +23.5% YoY.
- The EPS “consensus” is messy. Yahoo Finance’s 44-analyst mean is $5.94, with estimates running from $2.88 to $7.64. Most of that spread probably comes down to whether an analyst models the ~$10B Q3 legal accrual Meta announced on Aug 26. Check which number you’re comparing against before calling a beat or a miss.
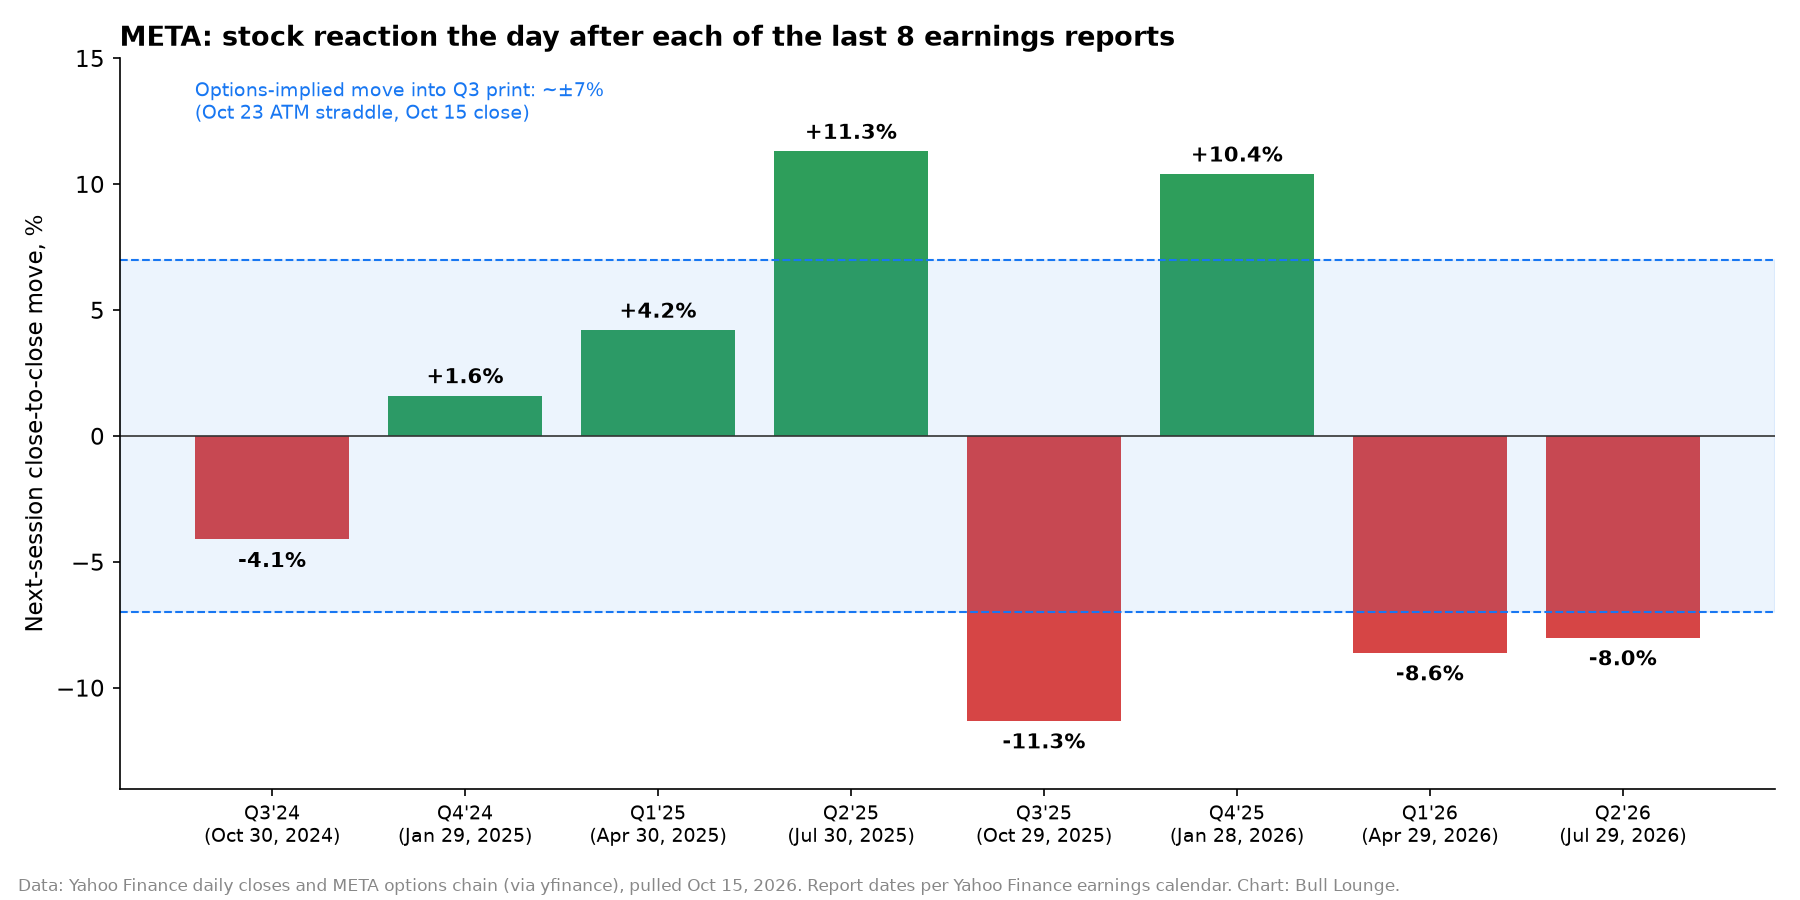
- The stock closed at $736.72, about 5.5% below its 52-week high of $779.82 and up roughly 37% from the post-Q2 close of $539.03. Options are pricing a move of about ±7% through Oct 23.
- The real swing factor is any first framing of 2027 capex/opex. Meta hasn’t guided it yet, and Street estimates are drifting higher.
Key dates
- Wed, Oct 21, 2026, after market close: Q3 results release, confirmed by Meta IR on Oct 12.
- Conference call: 1:30 PM PT / 4:30 PM ET the same day, with a webcast at investor.atmeta.com.
- Thu, Oct 22: first full trading session after the print.
- For context: the Q2 report came out Jul 29. The ~$10B legal accrual was announced Aug 26. Muse Wonder launched Oct 12, and Muse Spark Open (open weights, with Apple Mac support) launched Oct 15.
Consensus vs. guidance
- Q3 revenue | Meta guidance: $61–64B (~1pt FX headwind) | Street estimate: $63.30B (MarketBeat); $63.35B mean, range $61.70–65.28B (Yahoo, 48 analysts) | Year-ago (Q3’25): $51.24B
- Implied revenue growth | Meta guidance: +19% to +25% | Street estimate: ~+23.5% | Year-ago (Q3’25): +26.2%
- Q3 diluted EPS | Meta guidance: Not guided | Street estimate: $6.76 (MarketBeat); $5.94 mean, range $2.88–7.64 (Yahoo, 44 analysts) | Year-ago (Q3’25): $1.05 GAAP; $7.25 ex one-time tax charge
- Q3 legal accrual | Meta guidance: ~$10B, not included in the expense guide | Street estimate: Treatment varies by analyst | Year-ago (Q3’25): n/a
- FY26 total expenses | Meta guidance: $165–169B (before the ~$10B accrual) | Street estimate: n/a | Year-ago (Q3’25): n/a
- FY26 capex (incl. finance leases) | Meta guidance: $130–145B (H1 actual: $50.9B) | Street estimate: n/a | Year-ago (Q3’25): FY25: $72.2B
- FY26 operating income | Meta guidance: “Above 2025” ($83.28B), stated Jul 29 | Street estimate: n/a | Year-ago (Q3’25): n/a
- Tax rate (rest of 2026) | Meta guidance: 15–17% | Street estimate: n/a | Year-ago (Q3’25): n/a
- Q4 revenue (to be guided Oct 21) | Meta guidance: n/a | Street estimate: $73.74B mean (Yahoo, 46 analysts) | Year-ago (Q3’25): Q4’25: $59.89B
Quick math: a $10B pre-tax charge spread over ~2.56B diluted shares is roughly $3.90/share before tax. That’s our estimate; Meta hasn’t said how the charge will be treated for tax. It explains why a “$6.76 vs. $5.94” gap can exist at all. Also note Meta missed Q2 EPS ($6.18 vs. $7.19 consensus) even though revenue beat ($60.80B vs. $60.22B).
What to watch
1. Capex, and above all the first look at 2027
- Q2 capex was $31.08B in a single quarter, and free cash flow dropped to $784M. Hitting the $130–145B FY26 guide implies roughly $79–94B in H2, or about $40–47B per quarter.
- On the Q2 call, CFO Susan Li said Meta “aren’t providing a specific outlook for 2027 CapEx at this time.” Street numbers keep moving up anyway. Guggenheim raised its 2027 capex estimate to $225B from $203B (Oct 14, via Barron’s/Yahoo). Deutsche Bank put it at ~$210–215B back in July.
- Oppenheimer (Oct 15, via TheFly) notes Meta formally guides next-year expenses on the Q4 call. Even so, it expects “detailed commentary on 2027 expenses” this time and an EPS estimate reset. It models FY27/FY28 EPS about 10% below the Street.
- Also watch whether Q3 FCF goes negative, how much more debt Meta raises (long-term debt was $83.7B at Jun 30), and whether buybacks restart. There were none in H1 2026.
2. Muse and AI monetization
- The Muse agent launched in September with a free tier plus $20 and $100/month paid tiers (per Motley Fool). Muse Wonder followed on Oct 12, and today (Oct 15) Meta released Muse Spark Open weights alongside an Apple partnership to run the model on M5 Ultra Mac Studios.
- So far the only usage data is third-party, and the estimates vary. Guggenheim, citing Apptopia, puts Muse at about 1.3M daily average users over five weeks, which is under 0.05% of Meta’s 3.6B daily users. Citi estimates ~1.8M daily users and 6.6M+ downloads, and The Information reported 1M+ daily prompt users (both via Invezz, Oct 6). Muse Wonder API pricing is $4/$20 per million input/output tokens (Pomegra). The first official Muse metrics, or any paid-subscriber, API, or compute-rental revenue, would be the real news.
- Inside the core ads business: Advantage+ has passed a $75B annual run-rate, and FoA “other revenue” topped $1B in Q2 (+73% YoY). Watch impression growth (+14% in Q2) against price-per-ad growth (+12%).
3. Legal charge impact
- Meta said it expects to accrue “approximately $10 billion in Q3’26” tied to its agreement with 52 state and territory attorneys general. That agreement totals ~$18B over 10 years, of which ~$5.3B is contingent on YouTube and TikTok, and it is still pending court approval. Meta says the charge “was not contemplated” in its expense range.
- The key question is whether management still stands by “FY26 operating income above FY25.” H1 2026 operating income was $41.65B against an $83.28B FY25 bar.
- Also listen for the hit to teen engagement from the new defaults: a 2-hour daily limit, a midnight–6 AM block, and muted notifications during school hours. Meta also flagged other “youth-related trials” that “may ultimately result in a material loss.”
4. Reality Labs
- RL lost $4.62B in Q2 on $431M of revenue. That revenue was up 16% YoY on AI glasses, partly offset by weaker Quest sales. The year-ago Q3 loss was $4.43B on $470M of revenue. Over the trailing twelve months, losses total about $19.1B.
- Watch AI-glasses sell-through after Connect (Muse on glasses, Ray-Ban Meta Audio) and any change in how big the losses are expected to be.
Recent price action
- Close, Oct 15 | Value: $736.72 (–0.1% on the day)
- Oct 13 close / Oct 14 close | Value: $762.50 / $737.54 (–3.3% on Oct 14)
- 52-week high | Value: $779.82 (Sep 24, 2026), 5.5% above the current price
- 52-week low | Value: $520.26 (Mar 27, 2026)
- Since post-Q2 close ($539.03, Jul 30) | Value: +36.7%
- 1 month (vs. Sep 16 close) | Value: META +9.4% vs. QQQ +3.4% and S&P 500 +2.5%
- YTD (vs. $660.09 at end of 2025) | Value: +11.6%
- 20 / 50 / 200-day SMA | Value: ~$733.6 / ~$652.9 / ~$631.8
- Forward P/E | Value: ~21.3x (Yahoo)
- Analyst targets (Yahoo, 58 analysts) | Value: Mean $813.65, median $830, range $580–1,050
- Options-implied move | Value: ~±7% (Oct 23 at-the-money straddle, ~$51 on a ~$737 stock)
History says take the implied move seriously. The next-day reactions to the last four prints were –11.3% (Q3’25), +10.4% (Q4’25), –8.6% (Q1’26) and –8.0% (Q2’26). Each one was bigger than today’s ~7% implied move. On the chart, META has been rejected twice in the $762–780 zone since late September, and the Oct 7–9 lows around $712–720 are the nearest support.
Bull vs. bear reactions
What a bull reaction probably needs:
- Revenue at or above the top of the guide (~$64B) and a Q4 guide that brackets the ~$73.7B Street number. That would show ad growth holding in the 20s.
- Hard Muse numbers: users, paid subscribers, API or enterprise revenue.
- 2027 spending framed with explicit return targets, or with outside funding (partnerships, compute sales) that softens the FCF hit.
- The bulls on the Street: Truist and Wells Fargo at $1,000, UBS at $884 (raised from $715), Guggenheim at $850 (raised from $700).
What a bear reaction probably looks like:
- 2027 opex/capex commentary at or above the high Street estimates (opex ~$210–215B per Wells Fargo’s published view; capex $225B per Guggenheim) with no new revenue line to show for it.
- Management backing off “FY26 operating income above FY25,” or new legal or youth-trial reserves.
- Muse engagement that stays tiny relative to the user base, or a soft Q4 guide.
- The cautious voices: Goldman cut its target to $762 from $860 on higher 2027 opex (while keeping Buy), and Oppenheimer rates the stock Perform and has floated the possibility of an equity raise.
Our read: the ad business will probably deliver a solid revenue print again. The stock’s direction on Oct 22 will likely depend on the 2027 spending conversation, not the Q3 EPS line.
Want the full fundamental and technical breakdown? Our Stock Picks deep dive covers segments, valuation versus peers, key levels and 12-month scenarios: META Golden Cross Into Q3: Can the Muse Rally Survive the Capex Test?
What are you watching on Oct 21? Holding through the print, trimming, or waiting for the 2027 capex number? Post your revenue and EPS guesses below.
Not financial advice. This post is for informational and educational purposes only and reflects the author’s views as of Oct 15, 2026. It is not a recommendation to buy, sell or hold any security. Figures come from the sources below and may change. Do your own research.
Sources
- Meta IR: Meta to Announce Third Quarter 2026 Results (Oct 12, 2026)
- Meta IR: Meta Reports Second Quarter 2026 Results, plus the Q2 2026 earnings presentation and call transcript (Jul 29, 2026)
- Meta Form 10-Q for the quarter ended Jun 30, 2026 (SEC)
- Meta: Agreement With Bipartisan Attorneys General (~$10B Q3 accrual) (Aug 26, 2026)
- MarketBeat: Meta Platforms Q3 2026 Earnings Date & Estimates (accessed Oct 15, 2026)
- Yahoo Finance: META quote, analyst estimates, price targets, daily prices and options chain (pulled Oct 15, 2026 after the close)
- Yahoo Finance/GuruFocus: Guggenheim raises 2027 capex estimate to $225B (Oct 14, 2026)
- Yahoo Finance: Deutsche Bank 2027 capex ~$210–215B (Jul 2026)
- TipRanks/TheFly: Oppenheimer on FY27 cost reset (Oct 15, 2026)
- Stocktwits/TheFly: Goldman $762, UBS $884, Guggenheim $850; Apptopia Muse data (Oct 14, 2026)
- Invezz: Wells Fargo $1,000 target, 2027 opex $210–215B view; Citi and The Information Muse usage data (Oct 6, 2026)
- Pomegra: Truist target raised to $1,000; Muse Wonder API pricing (Oct 13, 2026)
- The Motley Fool: Muse pricing tiers (Sep 21, 2026)
- Meta AI: Introducing Muse Spark Open (Oct 15, 2026) and CNBC: Apple and Meta team up (Oct 15, 2026)
- Meta AI: Muse Wonder (Oct 12, 2026)
Derived figures (implied growth, implied H2 capex, per-share charge estimate, moving averages, returns, implied move, post-earnings reactions) are Bull Lounge calculations from the sources above.
Attachments:
Log in to vote -
AuthorPosts