 BTC
BTC  ETH
ETH  XRP
XRP SOL
SOL  DOGE
DOGE - This topic is empty.
-
AuthorPosts
-
September 24, 2026 at 3:46 pm #180
Lost in the AI-chip frenzy, Tesla has been building one of the steadier charts in large-cap tech: $380.12, above the 20-day ($363.21) and 50-day ($348.96), both rising, RSI 60.6 — bullish without excess.
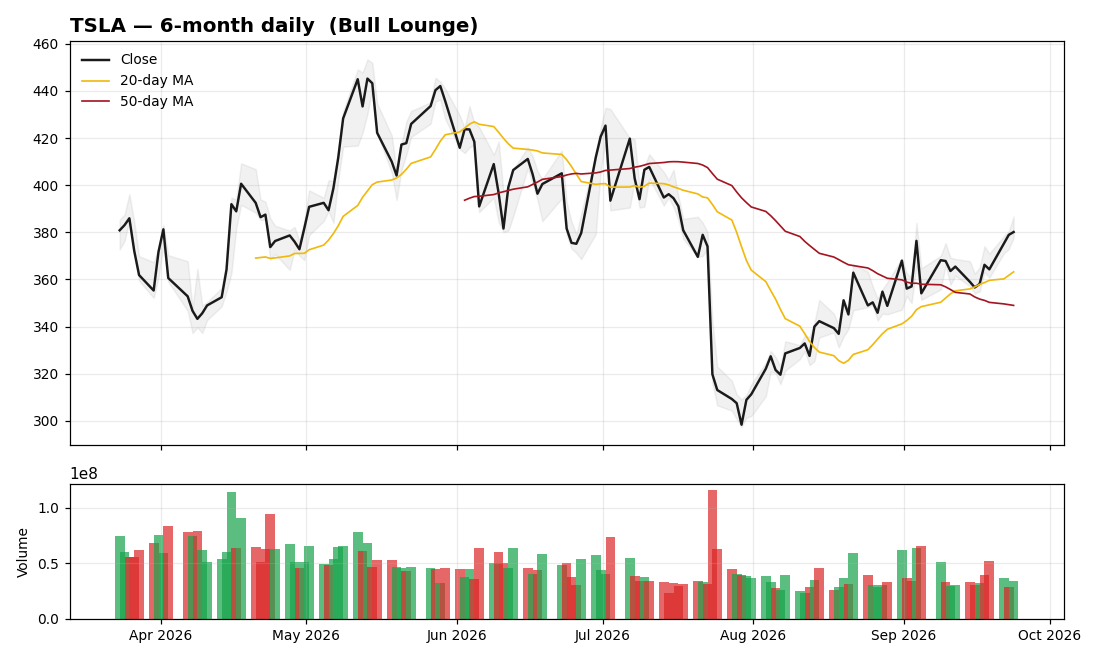
Structure: higher highs and higher lows from the $297 area, +8.5% in the last month. Nothing parabolic, nothing broken — just a methodical uptrend. -16.2% below the $453.40 May high, so there’s overhead supply to work through, but the trend sequence favors the bulls.
What makes TSLA’s chart interesting here: it’s rallying WITHOUT the AI-chip narrative doing the work — this is execution and sentiment repair. That independence is either diversification or a warning, depending on your view of the AI trade’s durability.
Levels: $400 psychological is the near-term gate; above that, $430–453 (May high) is the real test with the heaviest supply. Support: $363 (20-day), then $349 (50-day) — the trend’s foundation.
The setup: boring is good. A stock grinding higher on rising MAs with mid-range RSI is exactly the profile that survives market wobbles better than the high-beta names. If the AI trade hiccups, charts like this tend to outperform on a relative basis.
Watch: any robotaxi/energy news flow (the usual volatility triggers) and whether $400 flips from resistance to support. Data as of Sept 24, 2026 close. Not financial advice.
Log in to vote -
AuthorPosts

More from Chart Talkmore +
| Title | Author | Date | Replies |
|---|---|---|---|
| TSLA: 5-Year Consolidation Ending — Is Tesla’s Next Expansion Starting? [0] | Master | 10-11 | 0 |
| MU: Pinned at $1,100 Resistance as Wall Street Sees 50% Upside [0] | Master | 10-11 | 0 |
| GOOG: Weekly Triangle Squeeze — Breakout Toward $450? [0] | Master | 10-11 | 0 |
| SNDK: Trendline Broken — Is Sandisk Headed 59% Lower? [0] | Master | 10-11 | 0 |
| SOXL chart deep-dive: -51% from the high, but the structure is repairing [0] | Master | 09-24 | 0 |
| CRWV: -37% from highs, basing at $86? [0] | Master | 09-24 | 0 |
| AVGO: the odd one out — still below both moving averages [0] | Master | 09-24 | 0 |
| MU: the memory supercycle in one chart — 3.4x off the lows [0] | Master | 09-24 | 0 |
| SMCI: earnings cleared, trend repaired — holding $41 above both MAs [0] | Master | 09-24 | 0 |
| AMD: +28% in a month, RSI 71 — the chase-vs-wait dilemma [0] | Master | 09-24 | 0 |
| NVDA chart: coiling under $236.54 — the breakout setup [0] | Master | 09-24 | 0 |
| ETH just did what BTC couldn’t: +75% in three months [0] | Master | 09-24 | 0 |