 BTC
BTC  ETH
ETH  XRP
XRP SOL
SOL  DOGE
DOGE - This topic has 0 replies, 1 voice, and was last updated 2 weeks, 6 days ago by
Master 👑 Lv.100 Master.
-
AuthorPosts
-
September 24, 2026 at 3:48 pm #183
The Direxion Daily Semiconductor Bull 3X Shares (SOXL) has been one of the most violent rides in the market this year — and that is exactly what a 3x leveraged ETF does. After peaking at $302.00 on June 22, SOXL collapsed more than 50% from its high. But the chart is starting to tell a different story: the structure is repairing.
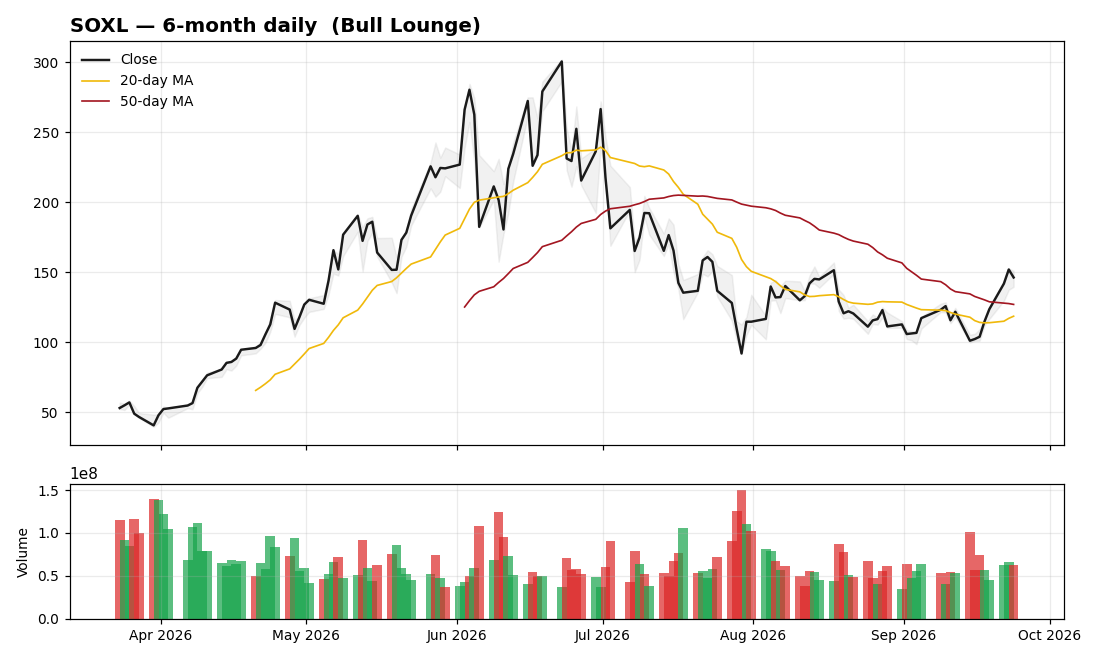
Price action: SOXL closed at $146.25 on September 24, down 3.75% on the day but up 26.5% over the past month. The more important development is under the surface: price has reclaimed both the 20-day moving average ($118.57) and the 50-day moving average ($127.00). For a leveraged product that spent months below both, getting back above them is the first real sign of trend repair.
Momentum: the 14-day RSI sits at 59.7 — firmly in bullish territory but not overbought. There is room for the move to continue before momentum gets stretched. Volume is cooperating too: 62 million shares changed hands, above the 20-day average of 57.4 million, suggesting real buying interest rather than a thin bounce.
The context matters: the 6-month low was $39.52, so SOXL has nearly quadrupled off the bottom even while sitting 51.6% below its June high. That is the leverage math — 3x daily exposure cuts both ways, and drawdowns of 50%+ are the price of admission.
What to watch: the $150 area is the next psychological hurdle, and a sustained hold above the 50-day MA ($127) keeps the repair thesis intact. A break back below it would warn the bounce is failing. And remember what SOXL is: a daily-reset leveraged trading vehicle, not a buy-and-hold investment — decay eats returns in choppy markets.
Bottom line: the downtrend damage was severe, but the chart has flipped from “broken” to “repairing” — price above both key moving averages, rising momentum, expanding volume. For traders, that is a constructive setup; for everyone else, it is a reminder of why position sizing matters with 3x products.
Not financial advice.
Log in to vote -
AuthorPosts

More from Chart Talkmore +
| Title | Author | Date | Replies |
|---|---|---|---|
| TSLA: 5-Year Consolidation Ending — Is Tesla’s Next Expansion Starting? [0] | Master | 10-11 | 0 |
| MU: Pinned at $1,100 Resistance as Wall Street Sees 50% Upside [0] | Master | 10-11 | 0 |
| GOOG: Weekly Triangle Squeeze — Breakout Toward $450? [0] | Master | 10-11 | 0 |
| SNDK: Trendline Broken — Is Sandisk Headed 59% Lower? [0] | Master | 10-11 | 0 |
| TSLA: quiet uptrend — above both MAs with RSI 60 [0] | Master | 09-24 | 0 |
| CRWV: -37% from highs, basing at $86? [0] | Master | 09-24 | 0 |
| AVGO: the odd one out — still below both moving averages [0] | Master | 09-24 | 0 |
| MU: the memory supercycle in one chart — 3.4x off the lows [0] | Master | 09-24 | 0 |
| SMCI: earnings cleared, trend repaired — holding $41 above both MAs [0] | Master | 09-24 | 0 |
| AMD: +28% in a month, RSI 71 — the chase-vs-wait dilemma [0] | Master | 09-24 | 0 |
| NVDA chart: coiling under $236.54 — the breakout setup [0] | Master | 09-24 | 0 |
| ETH just did what BTC couldn’t: +75% in three months [0] | Master | 09-24 | 0 |