 BTC
BTC  ETH
ETH  XRP
XRP SOL
SOL  DOGE
DOGE - This topic is empty.
-
AuthorPosts
-
September 24, 2026 at 3:46 pm #178
CoreWeave is the most debated AI-infrastructure name: $2.58B quarterly revenue (more than doubled YoY), a $104B backlog, raised guidance — and a stock still -37% below its $138.25 May high at $86.90. Growth vs. leverage, priced daily.
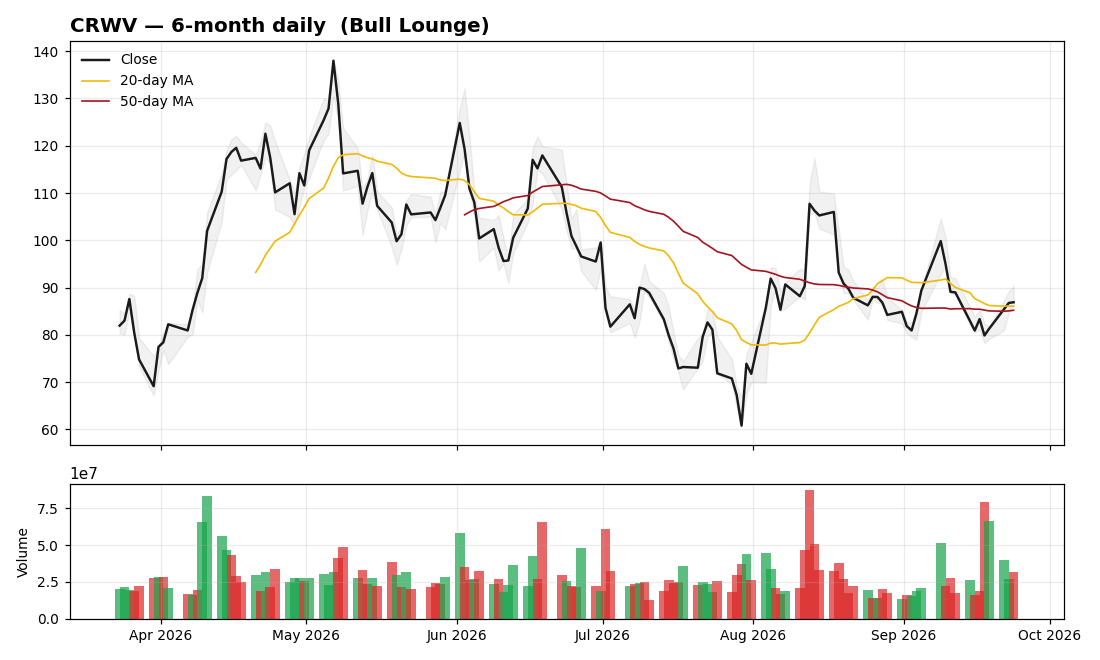
The chart: a long basing process since May. Price is pinched right at the 20-day ($86.05) and 50-day ($85.21) — both flat. RSI 50.3 — dead neutral. This is a coiled chart with no directional commitment: the moving averages have gone horizontal, which is what bottoms look like before they confirm (or fail).
What the bulls see: $104B backlog + $25B in new Q3 commitments + raised guidance = revenue visibility few companies on earth can match. The $2.6B delayed-draw term loan funds expansion against contracted demand.
What the bears see: heavy debt funding capex in a rising-rate environment (Fed just hiked 25bp), customer concentration, and the ever-present question of what happens to “GPU cloud” pricing when supply normalizes.
Levels: $86 is the pivot — a high-volume break above $95–100 targets the $110–120 breakdown zone; losing $80 re-opens $70. This is a “wait for the break” chart, not a “predict the break” chart.
Patience trade: basing patterns resolve, and when they do they move fast. Pick your trigger level in advance. Data as of Sept 24, 2026 close. Not financial advice.
Log in to vote -
AuthorPosts

More from Chart Talkmore +
| Title | Author | Date | Replies |
|---|---|---|---|
| TSLA: 5-Year Consolidation Ending — Is Tesla’s Next Expansion Starting? [0] | Master | 10-11 | 0 |
| MU: Pinned at $1,100 Resistance as Wall Street Sees 50% Upside [0] | Master | 10-11 | 0 |
| GOOG: Weekly Triangle Squeeze — Breakout Toward $450? [0] | Master | 10-11 | 0 |
| SNDK: Trendline Broken — Is Sandisk Headed 59% Lower? [0] | Master | 10-11 | 0 |
| SOXL chart deep-dive: -51% from the high, but the structure is repairing [0] | Master | 09-24 | 0 |
| TSLA: quiet uptrend — above both MAs with RSI 60 [0] | Master | 09-24 | 0 |
| AVGO: the odd one out — still below both moving averages [0] | Master | 09-24 | 0 |
| MU: the memory supercycle in one chart — 3.4x off the lows [0] | Master | 09-24 | 0 |
| SMCI: earnings cleared, trend repaired — holding $41 above both MAs [0] | Master | 09-24 | 0 |
| AMD: +28% in a month, RSI 71 — the chase-vs-wait dilemma [0] | Master | 09-24 | 0 |
| NVDA chart: coiling under $236.54 — the breakout setup [0] | Master | 09-24 | 0 |
| ETH just did what BTC couldn’t: +75% in three months [0] | Master | 09-24 | 0 |