 BTC
BTC  ETH
ETH  XRP
XRP SOL
SOL  DOGE
DOGE - This topic is empty.
-
AuthorPosts
-
September 24, 2026 at 3:45 pm #170
AMD is the hottest large-cap semi right now and the chart shows exactly why — and exactly why chasing it here is uncomfortable. $614.61, just 1.6% below its six-month high of $624.69 printed YESTERDAY (Sept 23).
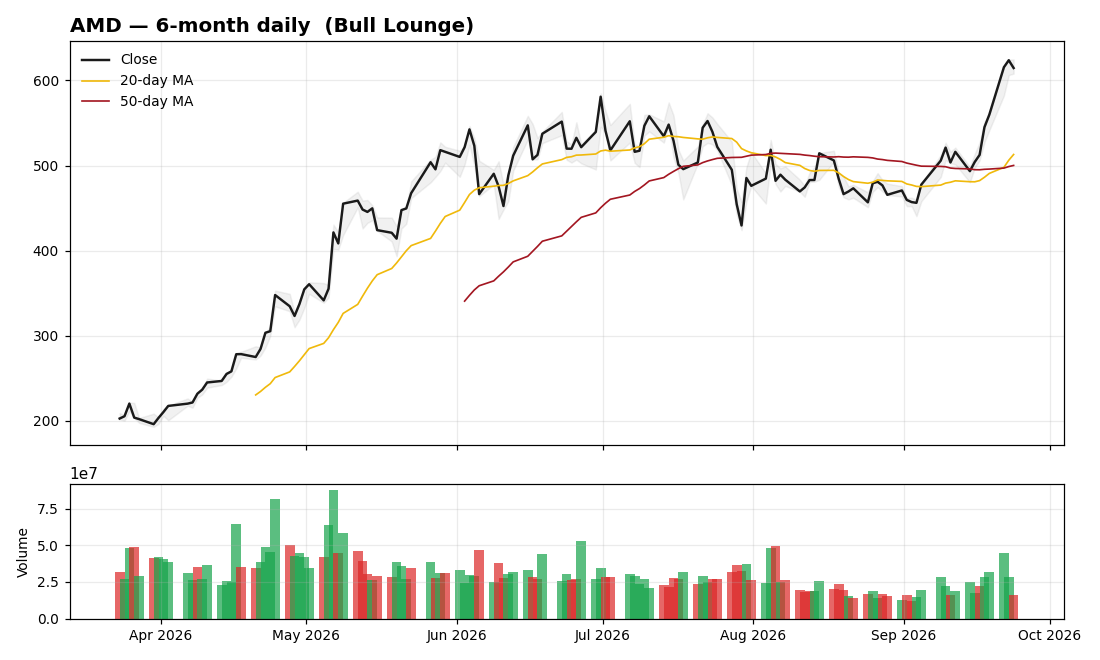
The run: +28.3% in one month, +15.4% in three months, from the $192 area six months ago — that’s a 3x move off the lows. Price is extended roughly 20% above its 50-day moving average ($500.12). In technical terms, this is a vertical move: powerful, but vertical moves resolve with sharp pullbacks as often as they continue.
Momentum: RSI(14) at 71.0 — officially overbought. Overbought can stay overbought (strong trends do that), but it means every new buyer here is paying a momentum premium with poor near-term risk/reward. The last two times AMD’s RSI pushed past 70 this year, a 8–12% pullback followed within two weeks.
Levels: support at $550–570 (last consolidation shelf), then the 20-day at $513. Resistance is simply new highs above $625.
How I’d frame it: AMD’s trend is undeniably up and the AI-chip bid is real, but the entry matters. Patient buyers wait for the RSI to cool and the 20-day to catch up; momentum traders ride it with a tight trailing stop under $570. Buying red-hot RSI 71 breakouts with no plan is how gains evaporate.
Scenarios: hold above $600 → $650–700 measured extension; lose $570 → $513 (20-day) test, which would actually be the healthier entry. Data as of Sept 24, 2026 close. Not financial advice.
Log in to vote -
AuthorPosts

More from Chart Talkmore +
| Title | Author | Date | Replies |
|---|---|---|---|
| TSLA: 5-Year Consolidation Ending — Is Tesla’s Next Expansion Starting? [0] | Master | 10-11 | 0 |
| MU: Pinned at $1,100 Resistance as Wall Street Sees 50% Upside [0] | Master | 10-11 | 0 |
| GOOG: Weekly Triangle Squeeze — Breakout Toward $450? [0] | Master | 10-11 | 0 |
| SNDK: Trendline Broken — Is Sandisk Headed 59% Lower? [0] | Master | 10-11 | 0 |
| SOXL chart deep-dive: -51% from the high, but the structure is repairing [0] | Master | 09-24 | 0 |
| TSLA: quiet uptrend — above both MAs with RSI 60 [0] | Master | 09-24 | 0 |
| CRWV: -37% from highs, basing at $86? [0] | Master | 09-24 | 0 |
| AVGO: the odd one out — still below both moving averages [0] | Master | 09-24 | 0 |
| MU: the memory supercycle in one chart — 3.4x off the lows [0] | Master | 09-24 | 0 |
| SMCI: earnings cleared, trend repaired — holding $41 above both MAs [0] | Master | 09-24 | 0 |
| NVDA chart: coiling under $236.54 — the breakout setup [0] | Master | 09-24 | 0 |
| ETH just did what BTC couldn’t: +75% in three months [0] | Master | 09-24 | 0 |