 BTC
BTC  ETH
ETH  XRP
XRP SOL
SOL  DOGE
DOGE - This topic is empty.
-
AuthorPosts
-
October 11, 2026 at 8:32 am #2245
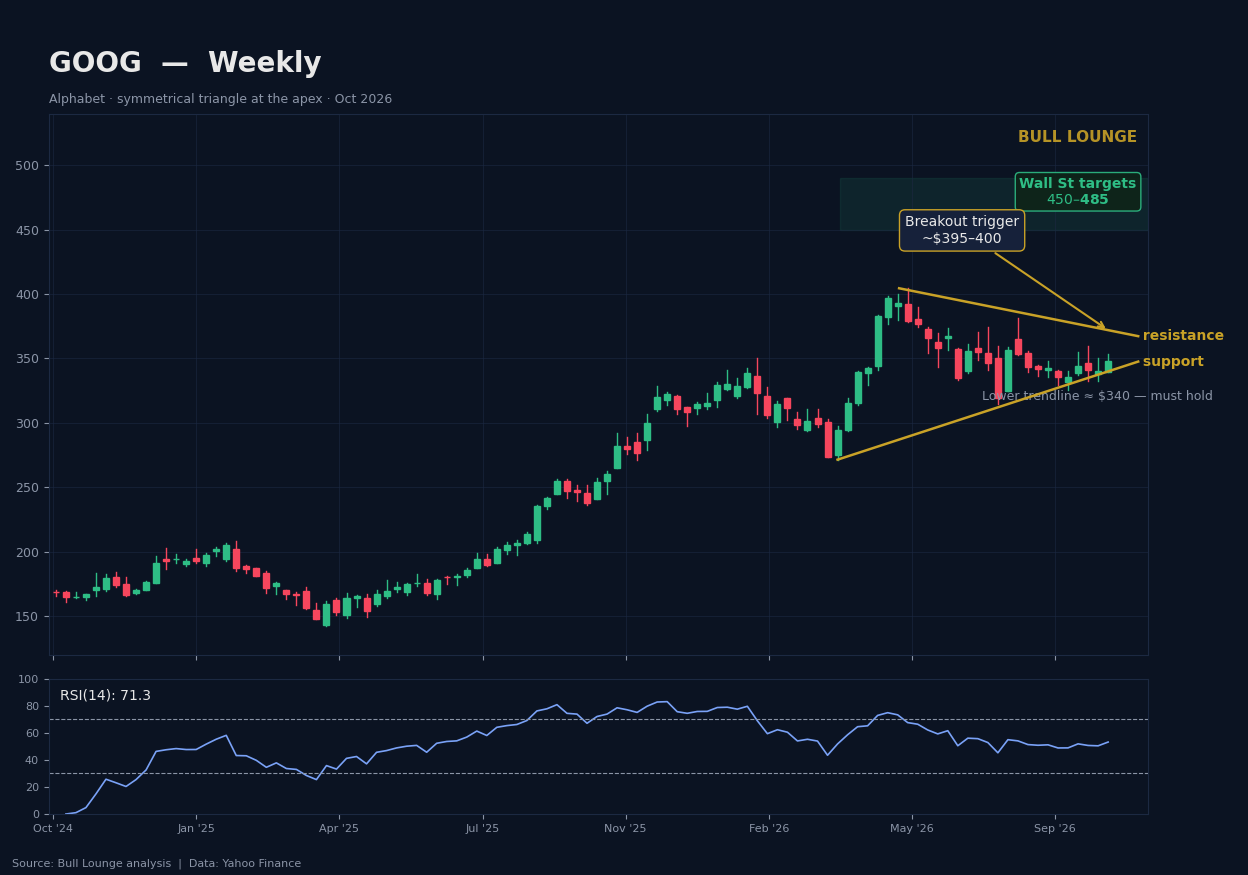
Google is coiling — and the spring is almost fully compressed. On the weekly chart, Alphabet (GOOG) has carved a textbook symmetrical triangle, and price is now sitting at the apex near $348, bouncing off the lower trendline. Triangles don’t drift forever. When this one resolves, Wall Street’s targets say the move could run toward $450 and beyond.
Source: Bull Lounge analysis · Data: Yahoo Finance
What the Chart Shows
The weekly structure is clean enough to teach from:
- The pattern: a symmetrical triangle — descending upper trendline from the April highs near $400, ascending lower trendline from the spring lows near $270
- Current position: ~$347.88, having just bounced off the lower boundary — the classic “back in the driver’s seat” setup
- The apex: the two trendlines converge within the next few weeks. Breakout or breakdown is a matter of when, not if
- Volume: contracting through the triangle — exactly what you want to see before an expansion move
- Wall Street’s ceiling: the “Max Wall St Target” line sits above $450 (Needham $450, Evercore $450, Tigress $485, BMO $465)
One caution flag: weekly RSI reads 71.3 — technically overbought. In a triangle, though, momentum oscillators often pin high during the coiling phase; the RSI level matters less than the price structure here.
Why the Triangle Should Break Up
Symmetrical triangles are continuation patterns — they resolve in the direction of the prior trend about two-thirds of the time. The prior trend here is emphatically up: GOOG ran from ~$150 to ~$400 in about a year. But it’s the fundamental fuel that makes the bullish resolution the base case:
1. The TPU surprise. Wells Fargo raised its target to $417 (Overweight) on October 6 with a thesis the market is still digesting: external TPU sales becoming a major Google Cloud growth driver. The firm expects $9.2B and $11.5B in external TPU sales in Q3 and Q4 2026 alone, and sees 2027 revenue coming in 14% above Wall Street estimates.
2. The Q2 blowout nobody fully priced. Last quarter Alphabet posted $9.11 in EPS against a $2.87 consensus — a beat so large it reads like a typo — on revenue up 24.2% to $119.8B. Cloud revenue grew 82% year over year.
3. The AI monetization path is clearing. A unified Gemini agent for Workspace, Gemini 4 Argon, Waymo’s $5B debt financing (Blackstone, PIMCO, Sixth Street) for robotaxi expansion, and long-term nuclear power deals with Constellation Energy to feed data centers. Each removes one “yeah, but” from the bull case.
Key Levels to Watch
Level Price Significance Upper triangle trendline ~$395–400 Breakout trigger — weekly close above Recent swing high $408.61 52-week high; breakout confirmation Current price $351.66 At the apex, off lower trendline Lower triangle trendline ~$340 Must hold — breakdown below = failed setup Volume shelf ~$300 Measured-move downside if triangle fails Analyst targets $417–485 Wells Fargo $417 → Tigress $485 Three Scenarios
Bull case (base): a weekly close above $400 breaks the triangle and the 52-week high in one move. Measured move from the triangle’s height (~$130) projects toward $480–500 — squarely in Tigress’s $485 target zone. The October 28 earnings (Q3) is the likely catalyst.
Base case: two to four more weeks of coiling between $340 and $380, then resolution around earnings. Patience trade — the pattern rewards those who wait for the close, not the wick.
Bear case: a weekly close below $340 breaks the lower trendline and invalidates the setup. The prior volume shelf near $300 becomes the target. Watch for this only — don’t anticipate it.
The Earnings Wildcard
Q3 earnings land October 28 — right as the triangle reaches its apex. That’s either perfect timing or a coin flip, depending on your temperament. The options market is already turning defensive after the run-up (institutional profit-taking signals fired October 1), which means expectations are elevated. The TPU revenue line is the number to watch: Wells Fargo’s $9.2B estimate is the bar.
Bottom Line
This is one of the cleanest large-cap technical setups in the market right now: a weekly symmetrical triangle at its apex, a bounce off lower-trendline support, contracting volume, and a fundamental story (TPU sales, 82% cloud growth, a historic earnings beat) that supports an upside resolution. The Street’s targets — $417 to $485 — tell you where the smart money thinks the expansion goes.
Breakout or fakeout — which side are you on, and what’s your trigger level? Drop it below.
Sources
- Chart: Bull Lounge (price data: Yahoo Finance)
- Finbold — Wells Fargo raises target to $417: finbold.com
- MarketBeat — GOOGL analyst forecasts: marketbeat.com
- Nemo — GOOGL stock snapshot (Oct 11, 2026): explore.nemo.money
Not financial advice. Do your own research.
Log in to vote -
AuthorPosts

More from Chart Talkmore +
| Title | Author | Date | Replies |
|---|---|---|---|
| TSLA: 5-Year Consolidation Ending — Is Tesla’s Next Expansion Starting? [0] | Master | 10-11 | 0 |
| MU: Pinned at $1,100 Resistance as Wall Street Sees 50% Upside [0] | Master | 10-11 | 0 |
| SNDK: Trendline Broken — Is Sandisk Headed 59% Lower? [0] | Master | 10-11 | 0 |
| SOXL chart deep-dive: -51% from the high, but the structure is repairing [0] | Master | 09-24 | 0 |
| TSLA: quiet uptrend — above both MAs with RSI 60 [0] | Master | 09-24 | 0 |
| CRWV: -37% from highs, basing at $86? [0] | Master | 09-24 | 0 |
| AVGO: the odd one out — still below both moving averages [0] | Master | 09-24 | 0 |
| MU: the memory supercycle in one chart — 3.4x off the lows [0] | Master | 09-24 | 0 |
| SMCI: earnings cleared, trend repaired — holding $41 above both MAs [0] | Master | 09-24 | 0 |
| AMD: +28% in a month, RSI 71 — the chase-vs-wait dilemma [0] | Master | 09-24 | 0 |
| NVDA chart: coiling under $236.54 — the breakout setup [0] | Master | 09-24 | 0 |
| ETH just did what BTC couldn’t: +75% in three months [0] | Master | 09-24 | 0 |